Earnings or Unemployment Report – April 2023

Highlights
- The cost of capital has risen in dramatic fashion over the last year and a half as a result of the most aggressive Federal Reserve hiking cycle in history (Figure 1).[1]
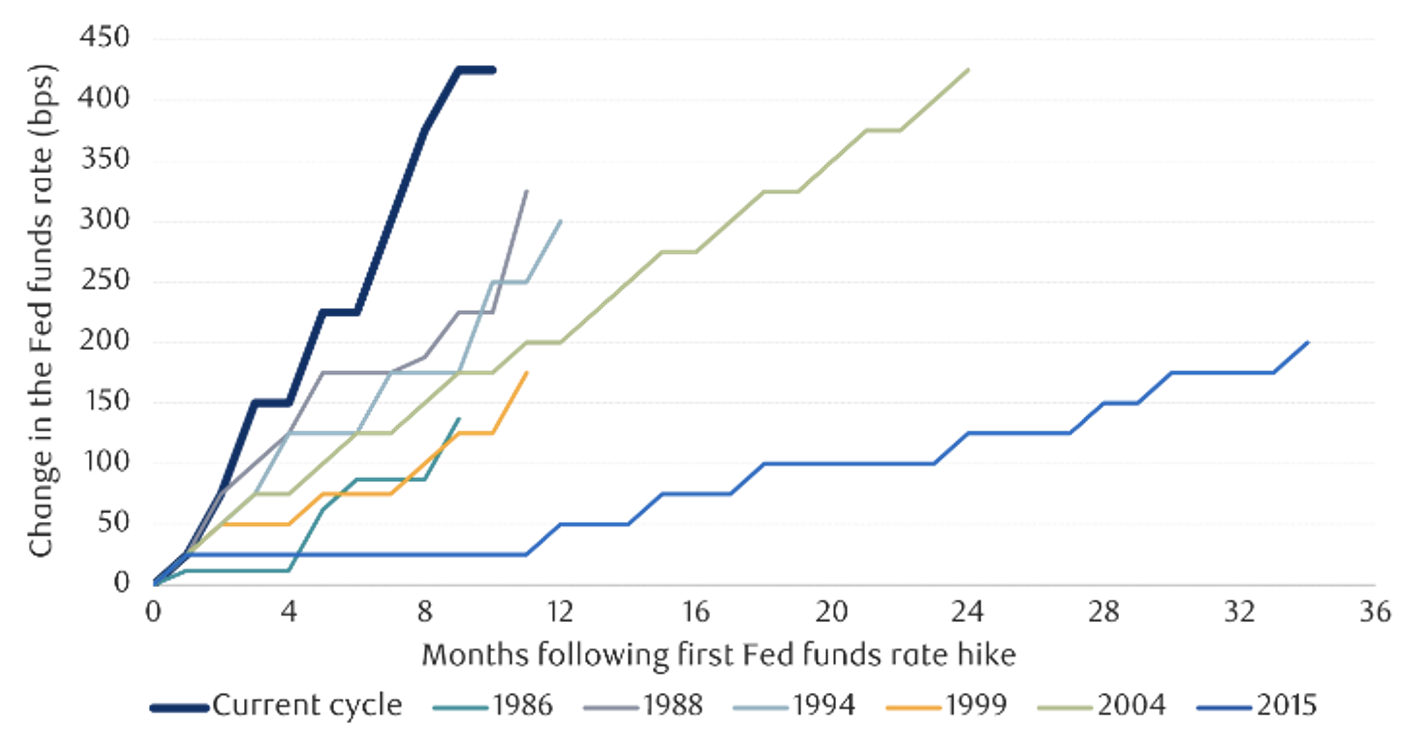
Figure 1 – Most aggressive Fed hiking cycle ever. Note: As of Jan. 16, 2023. Source: RBC Global Asset Management
- Companies will gradually feel the effect of these rate hikes as debt must be issued at higher rates and interest rates on floating rate debt moves higher.
- Most large cap companies are positioned well for this headwind because they locked in low fixed rate debt for long enough to not face an immediate risk.
- Small cap companies are exposed to considerable debt maturing and a high amount of floating rate debt within the next few years.
- Higher rates, along with “sticky” wage costs, will likely further pressure margins and cause further earnings decline.
- We believe a further decline in earnings will likely lead to more widespread layoffs. Historically, more widespread layoffs cause a more severe decline in earnings as people cut back on spending.
- So, which comes first, a more serious decline in earnings or higher unemployment?
- Previously, since these factors vary from one cycle to the next, it is hard to answer the “chicken or the egg” question.
- But the combination of 1) already negative earnings growth, 2) fastest Fed tightening cycle ever, 3) compressed margins, 4) already announced layoffs particularly in the tech industry, 5) regional banking issues gives us sufficient conviction earnings will decline further and unemployment will rise.
Higher cost of capital should continue to affect earnings moving forward.
- We do not believe the higher cost of capital is yet priced into earnings expectations. Indeed, S&P 500 Earnings Per Share (EPS) estimates are only for a ~-1.5% decline in 2023, and a ~9% increase in both 2024 and 2025 (Figure 2).
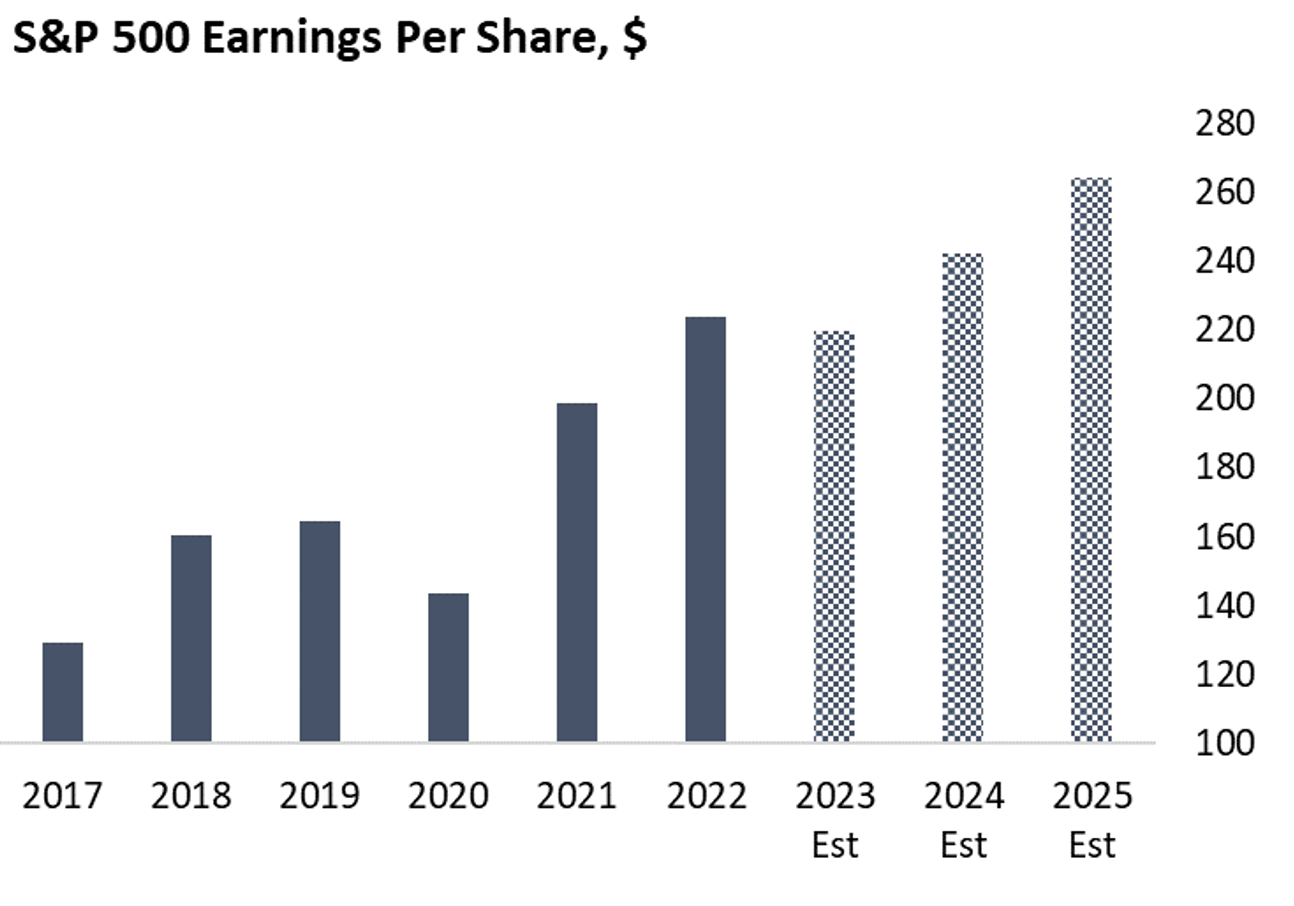
Figure 2 – S&P 500 EPS. Source: Bloomberg
- Over this time horizon, higher rates will ripple through the economy, as companies take on higher rates and floating rate debt interest rates move higher.
- Already, higher interest rates have affected earnings. Q1 2023 EPS for the S&P 500 declined ~1.4% year-over-year (yoy) according to Bloomberg estimates.
- S&P 500 average time to maturity on debt outstanding is ~12 years. This means larger companies are generally not at risk of immediately having to take on debt at higher rates, but as more debt comes due, companies will likely pay higher rates on outstanding debt.
- Small companies are much more exposed to higher interest rates. 42% of company’s debt in the S&P 600, which is an index comprised of ~600 small cap American stocks, is floating rate. 16% of the debt is maturing in 2023 and 2024, and the weighted average maturity of the debt is only 7.2 years.[2]
- We analyzed 1,126 companies with available data in the Russell 3000. By market cap, the largest portion of average time to maturity in the group was ten to twelve years, likely reflecting larger companies longer average time to maturity (Figure 3). But there is still a large share of companies with debt maturing in the next few years.
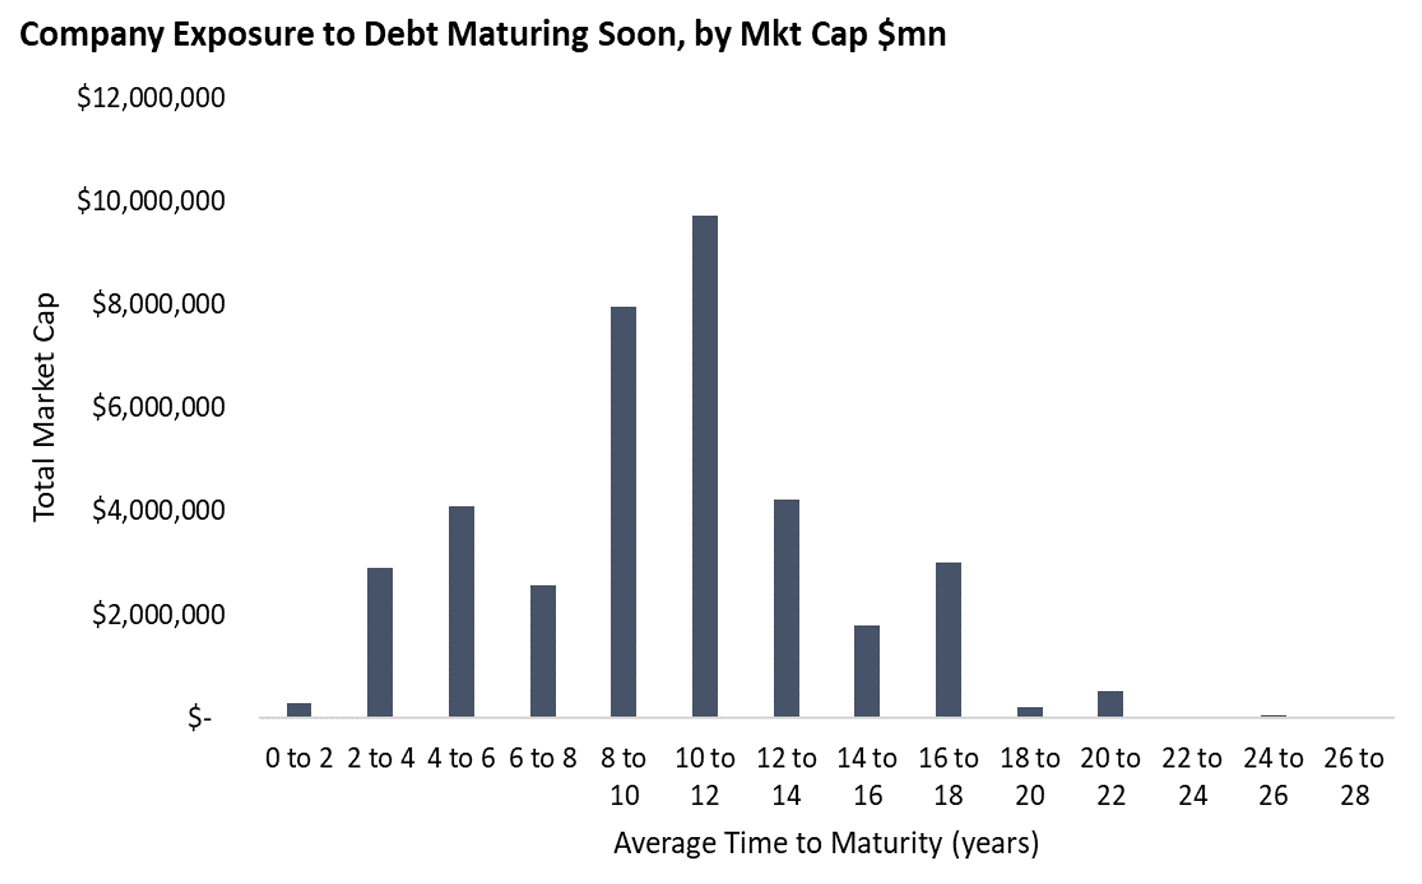
Figure 3 – Select Russell 3000 Exposure to Debt Maturity by Market Cap. Source: Bloomberg
- 33.39% of companies in this group have an average time to maturity of their outstanding debt of less than four years, and 63.05% have less than six years average time to maturity (Figure 4). These companies will likely have to take debt on at higher rates or cut back on spending.
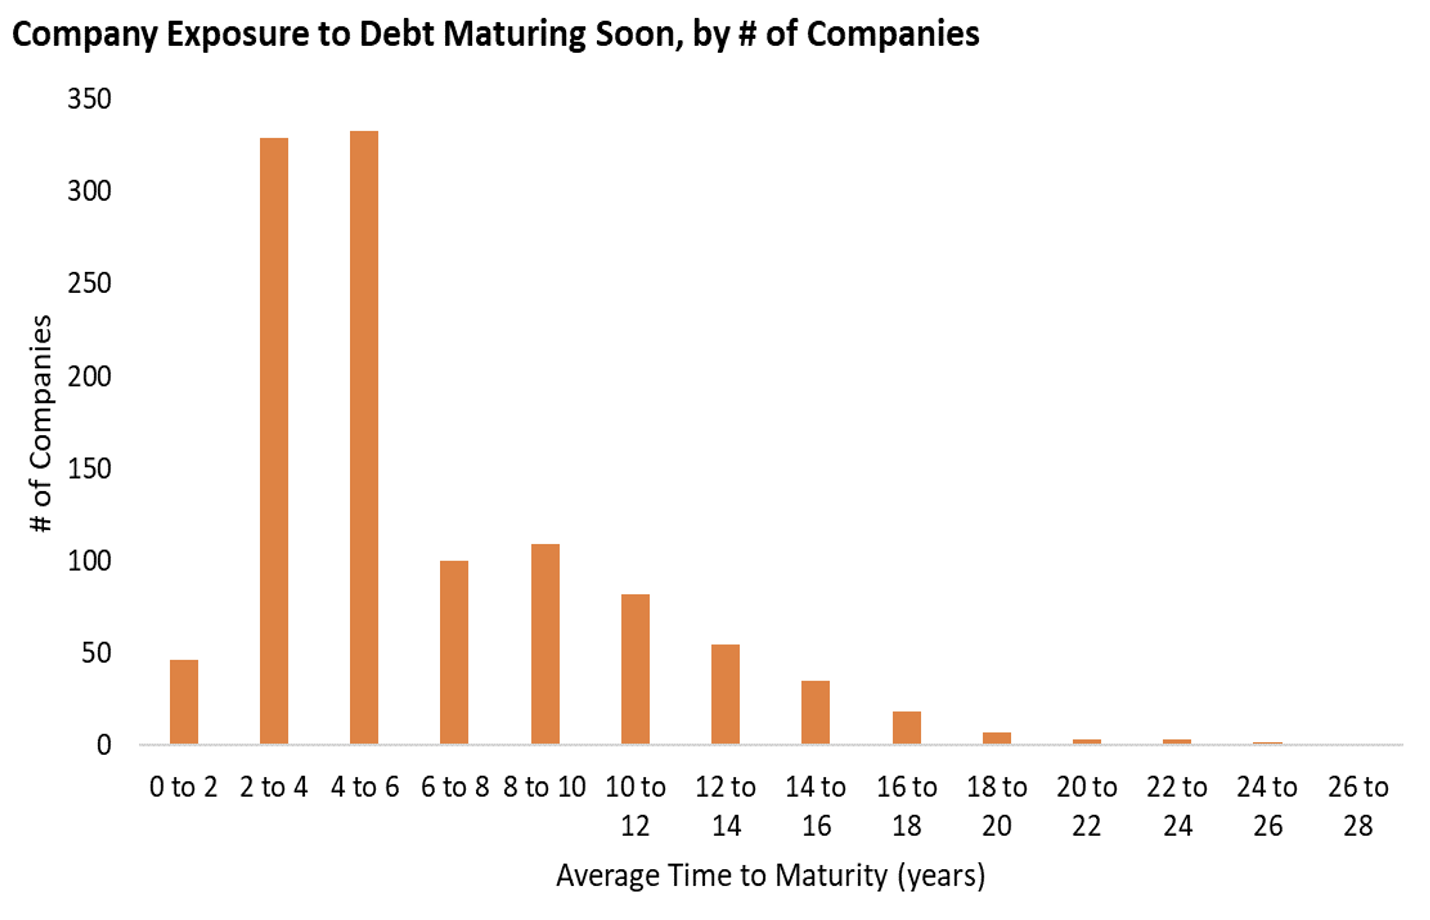
Figure 4 – Select Russell 3000 Exposure to Debt Maturity by # of Companies. Source: Bloomberg
- The average yield to maturity for this group’s outstanding debt is 5.60%. For context, in August of 2020 A-rated corporate 10-year yields were 1.487%. Today, they are 4.693% (going by the A+, A, A- BVAL yield curve available on Bloomberg).
- Corporate sentiment on the cost of capital is also depressed and at the lowest level since 2010 (Figure 5)[3].
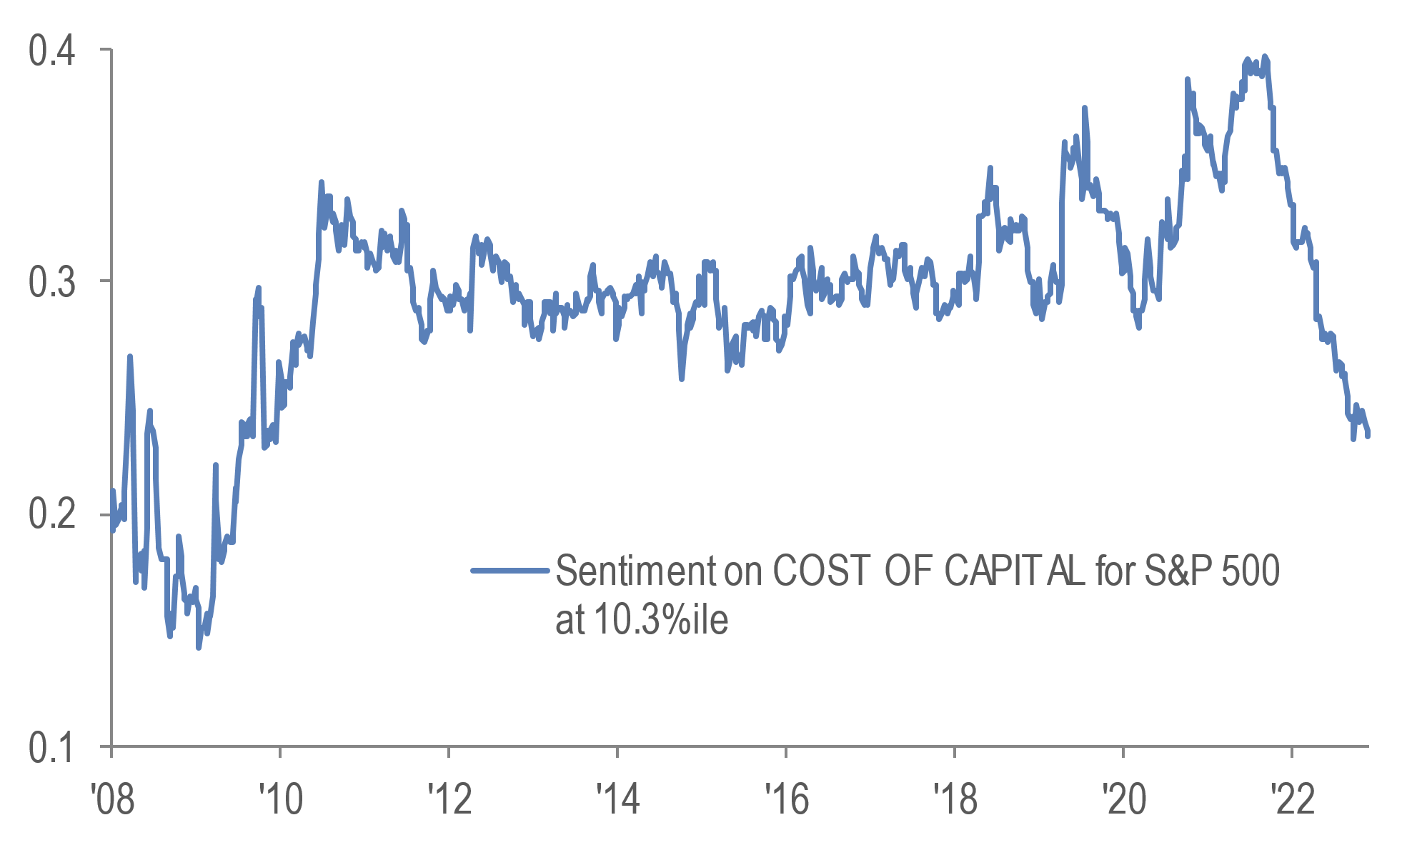
Figure 5 – Corporate sentiment on Cost of Capital. Source: JP Morgan Equity Macro Research
EPS should continue to decline with margins and layoffs will likely follow suit.
- As previously discussed, EPS has likely already declined year over year in Q1 2023, and is expected to fall for the entirety of the year for the S&P 500.
- Operating and profit margins have compressed. Weakness in operating margins indicates cost pressures are coming from higher cost of wages and goods (Figure 6).
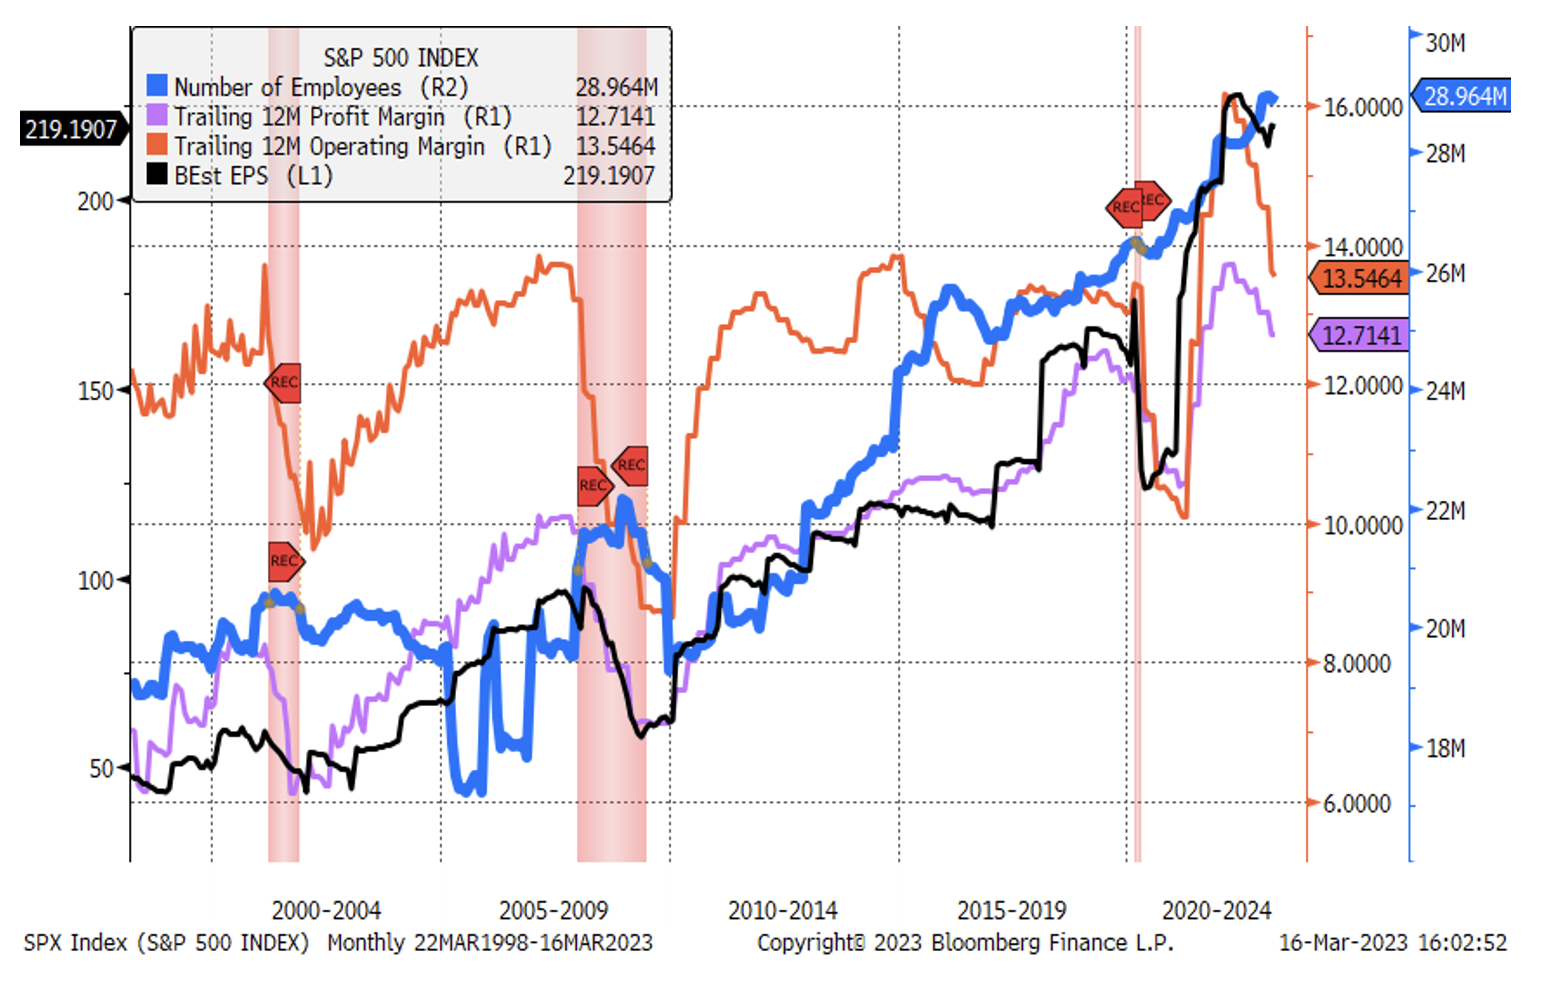
Figure 6 – S&P 500 financial and employee data. Source: Bloomberg
- The number of employees in the S&P 500 (Figure 6), Russell 2000, and Russell 1000 is at all time highs.
- Companies are typically slow to lay off employees. They wait to get confirmation of slowing business activity and then work to preserve their bottom line.
- The past three recessions have two things in common: Fed hiking rates and a yoy decline in EPS (Figure 7). EPS in 2015 did turn negative briefly but was not accompanied by the Fed hiking interest rates, and therefore did not result in a rise in unemployment and recession.
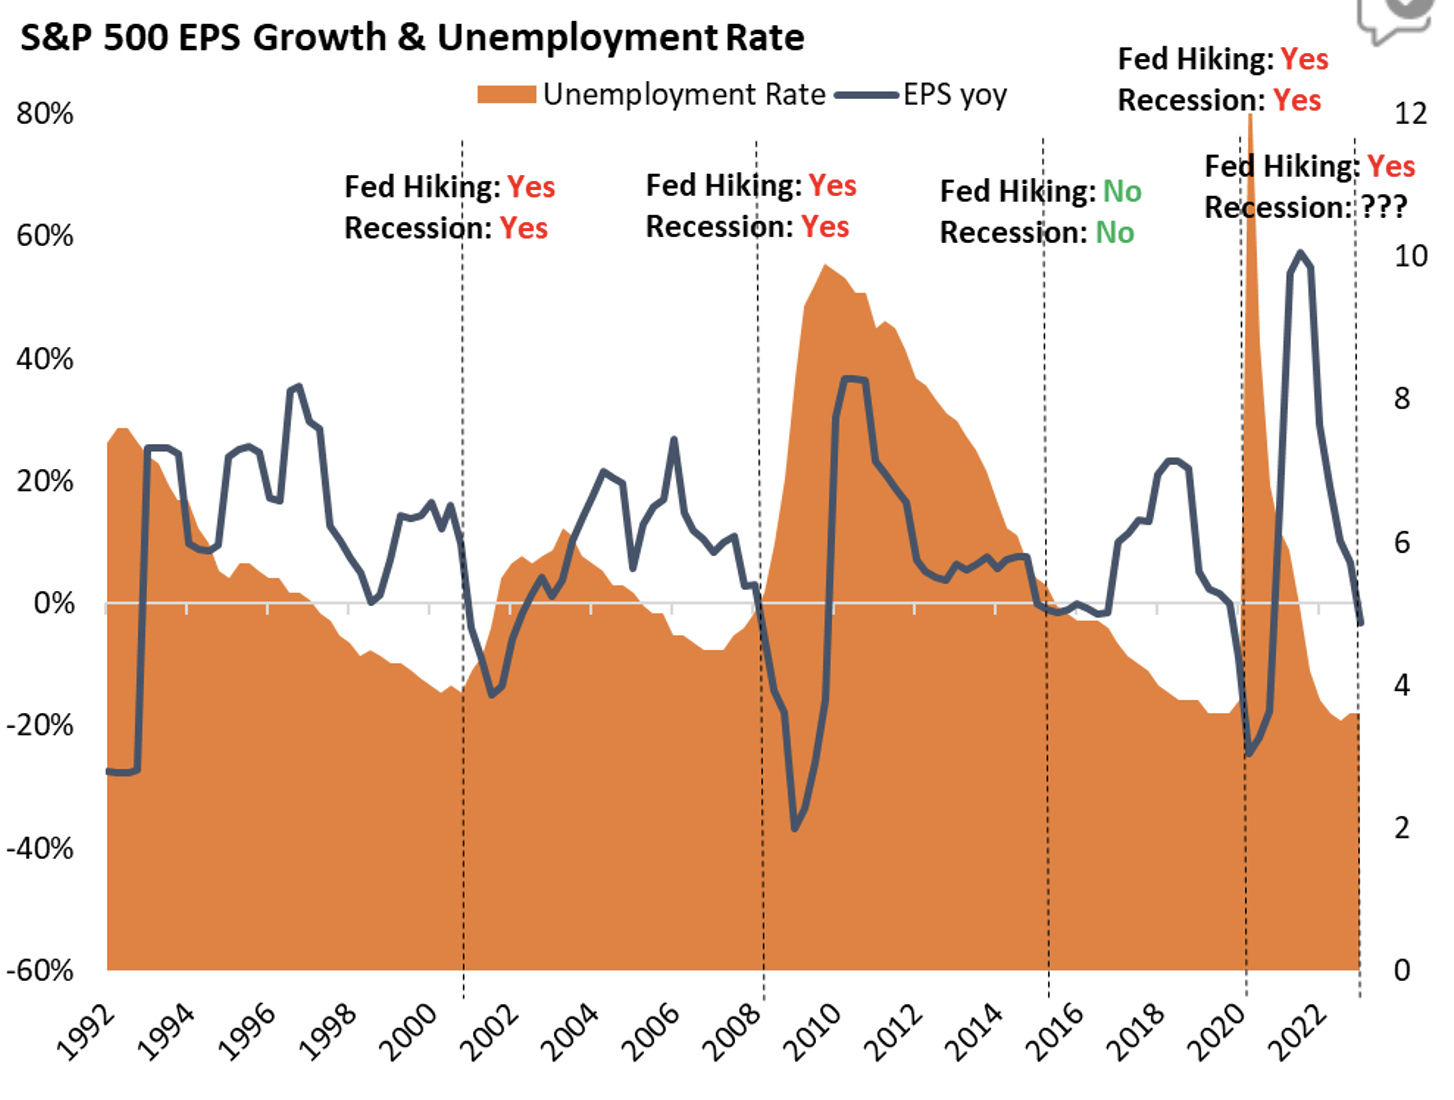
Figure 7 – S&P 500 EPS growth yoy and U.S. unemployment rate. Source: Bloomberg
- The current cycle has the most aggressive Fed hiking regime in history and EPS turned negative yoy in Q1.
- Along with already announced layoffs (particularly in the tech industry), regional banking issues, and the unemployment rate at the lowest point since the early 1970s, gives us conviction the unemployment rate will move up in the next twelve months.
- These factors are historically a catalyst for a further decline in earnings and a further rise in the unemployment rate.
Unless noted otherwise, information and charts used in this commentary were obtained via Bloomberg L.P.
The opinions expressed in this commentary should not be considered as fact. All opinions expressed are as of the published date and are subject to change. Information contained herein is not and should not be construed as an offer, solicitation, or recommendation to buy or sell securities. Investments in securities involves risk, will fluctuate in price, and may result in losses. The information has been obtained from sources we believe to be reliable; however no guarantee is made or implied with respect to its accuracy, timeliness, or completeness. It is suggested that you consult your financial professional, attorney, or tax advisor with regard to your individual situation. Comments concerning the past performance are not intended to be forward looking and should not be viewed as an indication of future results. Diversification does not protect against loss of principal.
Any projections, targets, or estimates in this report are forward looking statements and are based on the firm’s research, analysis, and assumptions. Due to rapidly changing market conditions and the complexity of investment decisions, supplemental information and other sources may be required to make informed investment decisions based on your investment objectives and suitability specifications. All expressions of opinions are subject to change without notice. Clients should seek financial advice regarding the appropriateness of investing in any security or investment strategy discussed in this presentation.
It is not possible to invest directly in an index. Investors pursuing a strategy similar to an index may experience higher or lower returns, which will be reduced by fees and expenses.
The S&P 500 Index is a well-known, unmanaged index of the prices of 500 large-company common stocks, mainly blue-chip stocks, selected by Standard & Poor’s. The S&P 500 Index assumes reinvestment of dividends but does not reflect advisory fees. The volatility of the benchmark may be materially different from the individual performance obtained by a specific investor. An investor cannot invest directly in an index.
Any charts, graphs, and descriptions of investment and market history and performance contained herein are not a representation that such history or performance will continue in the future or that any investment scenario or performance will even be similar to such chart, graph, or description.
Acumen Wealth Advisors, LLC® is a Registered Investment Adviser. Advisory services are only offered to clients or prospective clients where Acumen Wealth Advisors, LLC® and its representatives are properly licensed or exempt from licensure. Past performance is no guarantee of future returns. Investing involves risk and possible loss of principal capital. No advice may be rendered by Acumen Wealth Advisors, LLC® unless a client service agreement is in place.
[1] Riopelle, Sarah. “Navigating the Path Forward in 2023.” RBC Global Asset Management, Jan. 2023, https://www.rbcgam.com/en/ca/article/navigating-the-path-forward-in-2023/detail.
[2] Lakos-Bujas, Dubravko. “US Equity Strategy: The Cost of Higher for Longer.” J.P. Morgan, 27 Feb. 2023.
[3] Lakos-Bujas, Dubravko. “US Equity Strategy: Earnings Overview, Cost of Capital a Growing Concern.” J.P. Morgan, 9 Mar. 2023.