Q2 2024 Commentary

Recap and Introduction
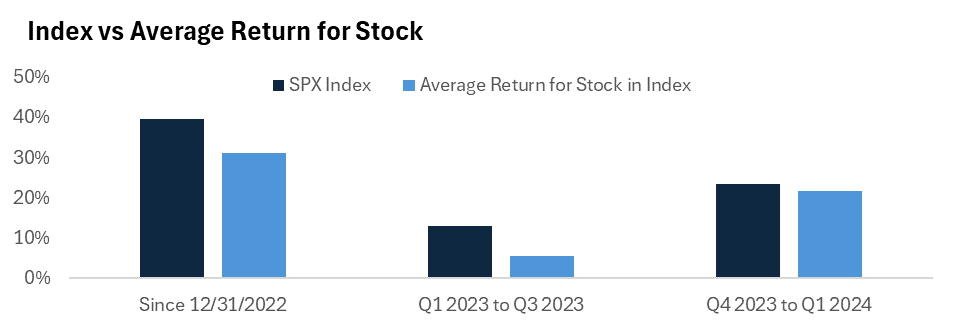
From the start of 2023 to the end of the third quarter, the S&P 500 Index increased more than 13% while the average return for a stock in the index was just over 5%. The gain in the index was primarily driven by stocks with a higher weight performing well while the average stock struggled. Over the last two quarters, the S&P 500 has increased more than 23% while the average stock has risen almost 22%, indicating much broader participation. The beginning of this rally was primarily driven by the rapid decline in interest rates late last year. For example, the 10-year treasury yield declined from about 5% to approximately 3.8% in the last six weeks of 2023. Since the start of the year, the 10-year yield has increased to around 4.3%. Despite this, stocks have continued to move higher. This increase likely occurred because economic data over the last several months has continued to an upside surprise. Leading indicators have moved higher:
- The manufacturing sector moved into expansion territory in March.
- The Leading Economic Index had a positive monthly change for the first time in more than two years in February.
- Housing activity has increased despite higher rates.
Market participants have also grown confident in the Fed’s ability to return inflation to 2%. This dynamic can help explain why the treasury yield curve has been inverted for the longest consecutive period in history using data back to 1970 (based on the 2-year treasury yield versus the 10-year treasury yield). Since the market believes the Fed will keep their benchmark rate higher during the near term, but at a lower level in the longer term, short-term interest rates are higher than long-term interest rates which has now been the case for almost two years. We believe current inflation levels warrant the Fed to keep rates higher over the near term. Service prices, excluding shelter in both the Consumer Price Index and the Fed’s preferred Personal Consumption Expenditure Price Index, have started to rise at a faster pace again over the last few months at a level the Fed is uncomfortable with the faster pace of rising prices. Additionally, energy prices have started to rise again, and home prices are rebounding along with housing market activity. These indicators may make the Fed hesitant to cut rates too quickly, which could cause a re-ignition of inflation like the 1970s, and other previous periods of high and volatile inflation.
Market Concentration
Stocks staged an impressive comeback in 2023 after poor performance in 2022. However, gains since 2022 have been concentrated in a few geographies, sectors, and names. Concentration can be seen in the dominance of U.S. stocks versus international stocks, the bifurcation of performance within technology related stocks versus other sectors, and the leadership of just a few names within the broad U.S. equity market index.
Since the start of the new decade, the domestic stock market has returned more than 65% while the entire world, excluding U.S. index, is up only around 20%. This large performance differential has caused the U.S. percentage of global stock market cap to rise to 50%. According to the International Monetary Fund, the United States makes up about 15.2% of global GDP when adjusted for currency factors.1 The end of U.S. dominance in the stock market has been long called for, but we find fundamental reasons have largely contributed to the outperformance of U.S. stocks. For instance, the earnings per share for U.S.-based companies have continued to rise at their historically average rate while earnings growth for international companies has stalled. Additionally, the strength of the U.S. dollar has largely contributed to the outperformance of U.S. stocks.
Concentration can also be seen within the performance of just a few sectors – mostly related to technology. Since 2022, the technology sector has contributed to 50% of the S&P 500’s returns. This environment has led to the sector weight within the index reaching 30%. The rise of the technology sector’s weight within stock market indices is most notable in the U.S. but has become apparent in other markets, too. Goldman Sachs has pointed out, through their research, that while global technology profits have surged since the financial crisis, other sectors in aggregate have made virtually no progress. COVID exaggerated significant trends within the sector we were beginning to see, but the rise in interest rates in 2022 dented earnings growth. However, the growth in profits has resumed over the past year for some of the largest contributors to the technology sector with the recent optimism surrounding AI. Once again, fundamental factors have largely contributed to the concentration now seen from a sector level in the stock market.
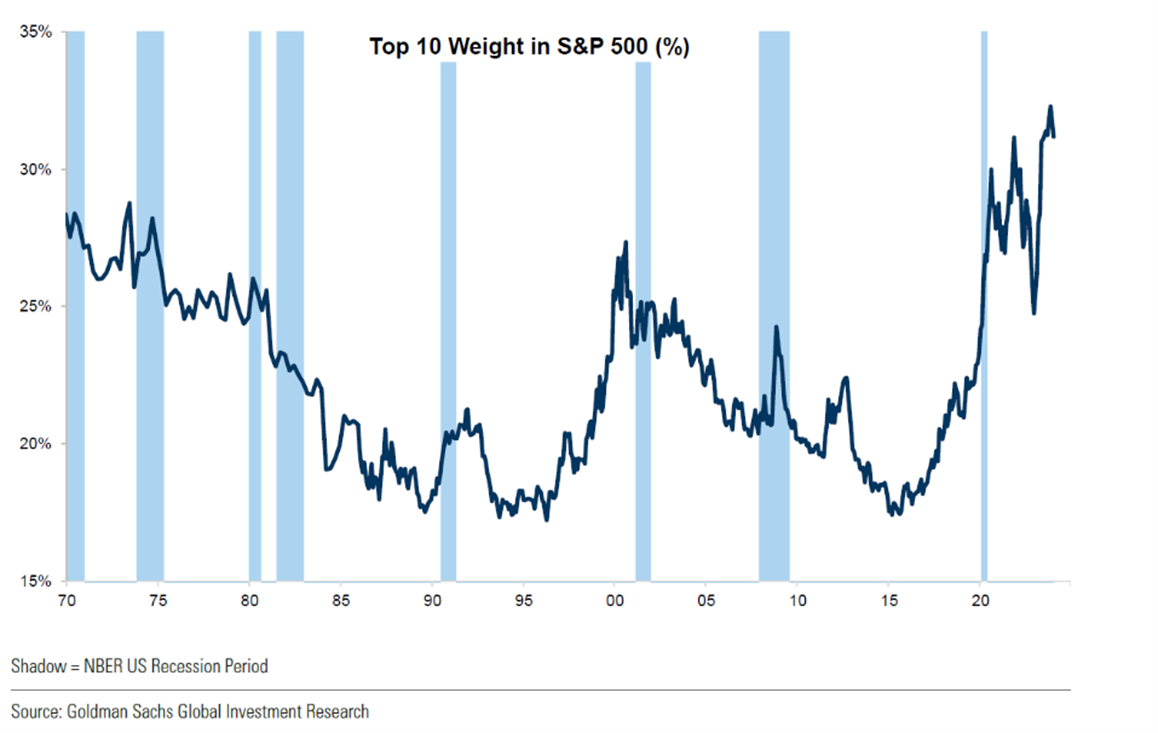
Concentration also exists at the security level. For instance, the ten highest weighted securities within the S&P 500 now total 34% of the index. Seen from the chart below, this concentration is the highest seen at least in recent memory. Ultimately, this means the index returns will be largely driven by the performance of a select few stocks, as much of it has since 2022. Again, the performance of these stocks, which has led to security concentration within the index, cannot be completely discounted, as the growth in expected profits has averaged a very high level for each. The change in multiple valuation (measured by P/E multiple) is also noticeable, as valuations were coming off depressed levels after the rise in interest rates during 2022.
Market concentrations are often referred to as risks, and we do not find this is completely unwarranted. In the past, concentrations have typically preceded large moves in market performance. However, we believe it is important to note it typically is not the concentration itself that presents the risk, but exogeneous events causing concentrations to have an outsized effect on total market performance. As we can see from each of the three concentration examples above, they are the result of fundamental developments within the market, such as earnings growth differentials. We do believe today marks an interesting period where portfolios can find diversification in what seems to be underappreciated areas, such as Emerging Markets and Small-/Mid-cap stocks. However, we are convicted an active approach must be taken to stock investing and not be too correlated with broad market indexes.
Labor Market Dynamics
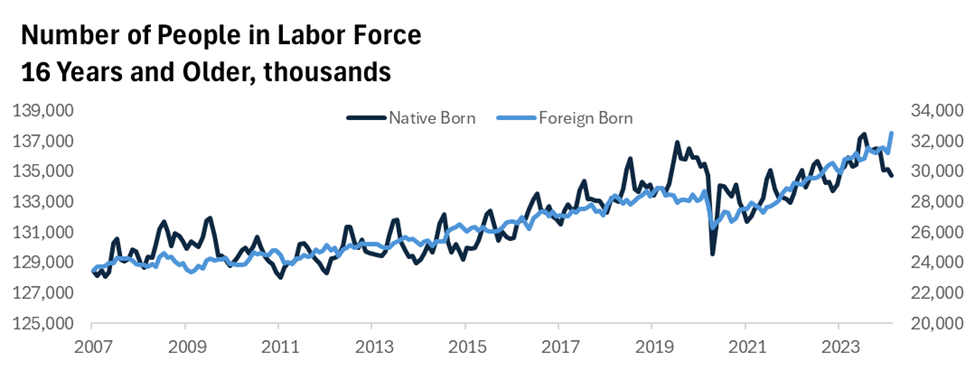
Over one million jobs were added in the U.S. in the last five months. The unemployment rate has risen to 3.8% since more people are searching for jobs, and not because of widespread layoffs. While a rising unemployment rate may seem like a bad thing, the market is interpreting this rise as the most favorable outcome since the Fed’s goal is to bring labor supply and demand into better balance. There is also some evidence that the labor market data has been affected by surges of immigration over the last few years. This surge could have helped to increase labor supply while also giving a bit of a boost to consumption, an ideal outcome for the Fed thus far. Indeed, the foreign-born labor force over 16 years old has grown by 4.1 million people since the middle of 2019 while the native-born labor force of the same age cohort has declined by 935,000. Main point: the labor market has come into better balance through an increase of supply rather than a deterioration in demand which has helped cool inflation without widespread job loss. Immigration may have played a key role in this development and helped to boost consumption. In our view, immigration has lowered the probability of a recession, but also may mean the Fed must keep their policy rate higher for longer than previously expected by the market.
Positioning
We had recommended a defensive tilt to portfolio positioning in 2022 and 2023. 2022 was a poor year for the stock market and one of the worst years in history for the bond market. However, 2023 brought better portfolio returns as the broad stock market recovered from the previous year’s slump and the bond market staged an impressive recovery. Going into 2024, we find reason to be positioned in a much more balanced manner relative to the defensive tilt over the previous two years since some of the macroeconomic headwinds have faded. The outlook for monetary policy is much less hawkish, the labor market has remained resilient, and inflation expectations are around historic averages. We remain cautious in adding too much risk to portfolios. However, risks remain, – geopolitical pressures in the Middle East, fiscal uncertainty, and market concentration remaining chief among them. All things considered, we find a more balanced allocation appropriate at this time.
Within allocations to stocks, we prefer to tilt away from passive exposure in the broad Large-cap stock market and focus more on high quality companies that can compound returns over time, as well as tactical areas such as Emerging Markets and Small-/Mid-cap stocks. As written, we see the concentration in passive market-cap weighted indexes as a risk, and these indexes should be diversified. EM equities and Small-/Mid-cap have been notable underperformers in the period post- Great Financial Crisis (GFC). We find reason to believe both Small-/Mid-cap stocks could have a resurgence of positive performance. Still, within both tactical allocations, investors should have active exposure, and a preference for high quality companies.
We continue to find Fixed Income an attractive asset class for investment, especially considering where starting yields are relative to long-term averages. There still is not significant clarity on how fast short-term rates will come down, so we still like some tactical allocations to short-term bonds. However, we are actively searching for attractive opportunities within the bond market to lock in rates for a longer period of time, as we are within portfolio exposures.
References1 https://www.imf.org/external/datamapper/profile/USA
Information used in this commentary was obtained via Bloomberg L.P.
The opinions expressed in this commentary should not be considered as fact. All opinions expressed are as of the published date and are subject to change. Information contained herein is not and should not be construed as an offer, solicitation, or recommendation to buy or sell securities. Investments in securities involves risk, will fluctuate in price, and may result in losses. The information has been obtained from sources we believe to be reliable; however no guarantee is made or implied with respect to its accuracy, timeliness, or completeness. It is suggested that you consult your financial professional, attorney, or tax advisor with regard to your individual situation. Comments concerning the past performance are not intended to be forward looking and should not be viewed as an indication of future results. Diversification does not protect against loss of principal.
The S&P 500 Index is widely regarded as the best single gauge of the U.S. equities market. The index includes a representative sample of 500 leading companies in leading industries of the U.S. economy. The S&P 500 Index focuses on the large-cap segment of the market; however, since it includes a significant portion of the total value of the market, it also represents the market. The Composite Index of Leading Indicators, otherwise known as the Leading Economic Index (LEI), is an index published monthly by The Conference Board. It is used to predict the direction of global economic movements in future months. The Index is composed of 10 economic components whose changes tend to precede changes in the overall economy. The Consumer Price Index (CPI) measures the overall change in consumer prices based on a representative basket of goods and services over time. The CPI is one of the most popular measures of inflation and deflation.
All indexes are unmanaged and an individual cannot invest directly in an index. Index returns do not include fees or expenses.
Any charts, graphs, and descriptions of investment and market history and performance contained herein are not a representation that such history or performance will continue in the future or that any investment scenario or performance will even be similar to such chart, graph, or description.
Acumen Wealth Advisors, LLC® is a Registered Investment Adviser. Advisory services are only offered to clients or prospective clients where Acumen Wealth Advisors, LLC® and its representatives are properly licensed or exempt from licensure. Past performance is no guarantee of future returns. Investing involves risk and possible loss of principal capital. No advice may be rendered by Acumen Wealth Advisors, LLC® unless a client service agreement is in place.