Q4 2024 Market Commentary

Economic growth remained positive in the third quarter of 2024, despite economists’ and market commentators’ expectations for growth to fall because of higher interest rates and a slowing labor market. The Federal Reserve announced a pivot in their monetary policy in September when they cut their benchmark interest rate by 0.5% from 5.5% to 5.0%.
Two weeks after the Fed’s first rate cut since Covid-19, a jobs report showed employers added 245,000 jobs in September and the unemployment rate declined for the second month in a row from 4.2% to 4.1%. Experts believe the “breakeven rate” for payrolls to be around 150k to 180k and the average during the pre-Covid decade was around 180k, so the jobs report concluded the labor market was not loosening as much as previously thought.
In our last quarterly letter, we mentioned the unemployment rate had risen due to more people entering the workforce who were finding it harder to secure employment and not an increase in layoffs. The Fed’s decision to cut rates by double their standard move (0.25%), and a preceding payrolls report, which showed the labor market is still strong, proves monetary policy authorities must walk a tight line between remaining too restrictive for too long versus easing policy too quickly and potentially reigniting inflation. Key inflation measures have fallen throughout this year, but the pace of decline has tapered off. Still, a Gallup poll from Spring of this year shows close to 40% of U.S. families believe inflation is the most important financial problem1.
The decision to begin cutting interest rates was followed by bond yields falling. Historically, when interest rates move lower outside of a recession, stocks perform well. If economic growth remains around its long-term trend, and the Fed can gradually ease monetary policy without sparking higher inflation, then there is a positive outlook for the forward returns on stocks and bonds.
Risks remain, however. One risk we are closely considering is a possible resurgence in inflation due to easing monetary policy in an economy which is still growing +2%. In either case, we have mentioned in previous commentaries we think the average inflation rate will be higher in the next decade than the decade before Covid. We are reminded the average 12-month return for S&P 500, when inflation has averaged between 2% to 5%, is around 10%. Two other risks we are paying attention to are the November election and the ongoing geopolitical conflicts in the Middle East and Ukraine.
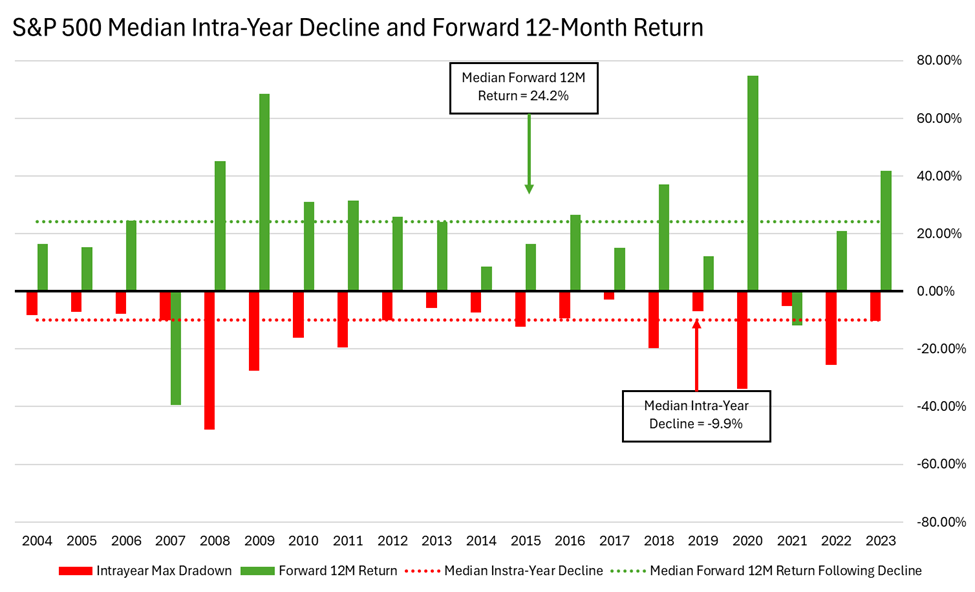
While implied volatility has picked up in recent months, likely due to the factors mentioned above, the stock market has continued moving higher. Investors should be reminded of the normalcy of volatility. The median intra-year decline for the S&P 500 index over the last 20 years is (-10%). However, the forward 12-month return for stocks from the point of maximum drawdown is close to +25%. The average upside for stocks directly following periods of uncertainty inherently represents the positively skewed risk versus reward for stocks over the long term. For this reason, we look at volatility as a buying opportunity for assets.
In recent periods, we have increased exposure to areas of the stock market, which we believe are underinvested, could benefit from the continuation of the current environment, and could even diversify portfolios if some of the risks mentioned materialize. Small and mid-cap stocks and emerging markets are two areas we find more attractive today. Both areas have not matched the strong performance of the large-cap domestic market since 2019 but have multiple catalysts for growth.
The macro environment seems more tilted towards growth than it did in our last quarterly letter, with a key risk now being the balance from monetary policy authorities between easing policy and stoking inflation. As mentioned, we remain underweight exposure to highly concentrated areas of the stock market and have prioritized diversification.
Sources
Information used in this commentary was obtained via Bloomberg L.P.
The opinions expressed in this commentary should not be considered as fact. All opinions expressed are as of the published date and are subject to change. The information contained herein is not and should not be construed as an offer, solicitation, or recommendation to buy or sell securities. Investments in securities involve risk, will fluctuate in price, and may result in losses. The information has been obtained from sources we believe to be reliable; however, no guarantee is made or implied with respect to its accuracy, timeliness, or completeness. It is suggested that you consult your financial professional, attorney, or tax advisor with regard to your individual situation. Comments concerning past performance are not intended to be forward-looking and should not be viewed as an indication of future results. Diversification does not protect against loss of principal.
This report contains forward-looking statements. Forward looking statements include, but are not limited to assumptions, estimates, projections, opinions, models and hypothetical performance analysis. Forward-looking statements involve significant elements of subjective judgments and analyses and changes thereto and/or consideration of different or additional factors could have a material impact on the results indicated. Due to various risks and uncertainties, actual results may vary materially from the results contained herein. No representation or warranty is made by Acumen Wealth Advisors, LLC® as to the reasonableness or completeness of such forward-looking statements or to any other financial information contained herein.
Any charts, graphs, and descriptions of investment and market history and performance contained herein are not a representation that such history or performance will continue in the future or that any investment scenario or performance will even be similar to such chart, graph, or description.
The S&P 500 Index is widely regarded as the best single gauge of the U.S. equities market. The index includes a representative sample of 500 leading companies in leading industries of the U.S. economy. The S&P 500 Index focuses on the large-cap segment of the market; however, since it includes a significant portion of the total value of the market, it also represents the market.
All indexes are unmanaged, and an individual cannot invest directly in an index. Index returns do not include fees or expenses.
Acumen Wealth Advisors, LLC® is a Registered Investment Adviser. Advisory services are only offered to clients or prospective clients where Acumen Wealth Advisors, LLC® and its representatives are properly licensed or exempt from licensure. Past performance is no guarantee of future returns. Investing involves risk and possible loss of principal capital. No advice may be rendered by Acumen Wealth Advisors, LLC® unless a client service agreement is in place.